Ascending and Descending Staircases Chart Pattern
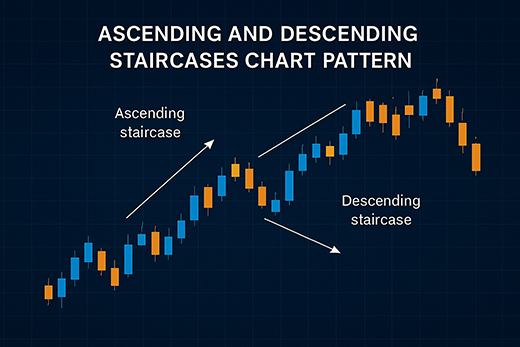
The Ascending and Descending Staircases chart patterns are variations of a trend-following pattern that typically appear in trending markets. These patterns are characterized by a series of higher highs and higher lows (ascending) or lower highs and lower lows (descending), which form step-like structures that resemble the shape of a staircase. They are most commonly observed in the forex, stock, and commodity markets, where trends are more defined.
Ascending Staircase Chart Pattern
Definition:
An ascending staircase pattern is a bullish chart formation that indicates a strong uptrend. In this pattern, each successive high is higher than the previous high, while each successive low is also higher than the preceding low. This results in a step-like structure, where the price seems to climb up in a staircase-like formation.
Key Characteristics:
- Higher Highs: The price makes successive higher highs, indicating upward momentum.
- Higher Lows: Each successive low is higher than the previous one, showing that support levels are moving up.
- Steady Trend: The pattern represents a steady uptrend with consistent buying pressure, usually driven by strong market sentiment or positive news.
- Breakout Point: The pattern confirms when the price breaks above a previous resistance level or continues its upward trajectory after a pullback.
Trading Strategy:
- Entry Point: Traders typically enter long positions when the price breaks above a previous higher high or after a minor pullback that respects the higher low.
- Stop Loss: A stop loss can be placed below the last higher low to manage risk.
- Profit Target: The profit target is often based on the measured move of the pattern, using the height of the staircase formation to project the potential price movement.
Example: If the price of a currency pair rises from 1.3000 to 1.3100 (higher high), then retraces to 1.3050 (higher low), followed by another rise to 1.3200 (next higher high), this forms the initial part of an ascending staircase.
Descending Staircase Chart Pattern
Definition:
A descending staircase pattern is the inverse of the ascending staircase, signaling a bearish market trend. In this pattern, each successive high is lower than the previous high, and each successive low is also lower than the preceding low. This creates a step-like downward formation, as if the price is descending a staircase.
Key Characteristics:
- Lower Highs: The price makes successive lower highs, showing a reduction in upward momentum.
- Lower Lows: Each successive low is lower than the previous one, indicating that the bears are gaining control of the market.
- Steady Decline: The pattern represents a strong bearish trend where sellers dominate, often due to negative sentiment or unfavorable news.
- Breakdown Point: The pattern signals a breakdown when the price falls below the last support level or when the price continues downward after a retracement.
Trading Strategy:
- Entry Point: Traders typically enter short positions when the price breaks below the previous lower low or after a minor rally that respects the lower high.
- Stop Loss: A stop loss can be placed above the last lower high to limit potential losses.
- Profit Target: As with the ascending staircase, the profit target is typically based on the height of the pattern, projected from the breakdown point.
Example: If the price of a stock falls from 50 to 48 (lower low), then rises slightly to 49 (lower high), and then drops further to 46 (next lower low), this forms the early stages of a descending staircase.
Identifying the Staircase Patterns
To successfully identify both ascending and descending staircase patterns, traders should look for the following:
- Clear Trend: The pattern works best in markets that exhibit a clear and sustained trend.
- Consistency: The steps should maintain a consistent rhythm in terms of higher highs and higher lows (for ascending) or lower highs and lower lows (for descending).
- Timeframe: These patterns can form over various timeframes but are more reliable on longer timeframes (such as daily or weekly charts).
Advantages of Using Staircase Patterns
- Clear Trend Identification: The pattern offers an easy-to-recognize structure that helps traders confirm whether the market is in a bullish or bearish trend.
- Risk Management: The ascending staircase provides clear support levels, while the descending staircase offers well-defined resistance levels. This allows for more accurate risk management through stop-loss placements.
- Momentum Confirmation: Both patterns confirm the momentum of the market, helping traders align their trades with the prevailing trend.
Limitations of Staircase Patterns
- Choppy Markets: In sideways or volatile markets, the formation of a clear staircase pattern can be difficult, leading to false signals.
- False Breakouts: Sometimes the price may break above or below the staircase but fail to maintain the trend, resulting in a false breakout.
- Requires Patience: These patterns develop over time and require patience for traders to spot and trade effectively.
Conclusion
The ascending and descending staircase chart patterns are useful for traders who want to trade in the direction of the prevailing trend. These patterns provide clear signals for entries and exits, helping traders take advantage of trending markets. However, traders must be cautious of false breakouts and choppy market conditions that may lead to unreliable signals. By combining the staircase pattern with other technical indicators and proper risk management strategies, traders can enhance their chances of success in the market.